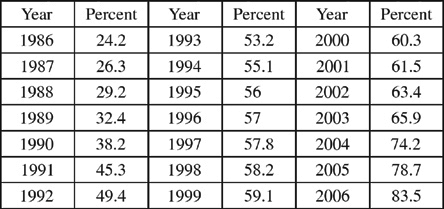
The table below shows the percents of U.S. citizens who had ever consumed a certain brand-name soda, out of all soda consumers, for each year from 1986 through 2006.
The figure below shows a scatterplot of the data in the table and solid lines that are possible models for the data. Which of the 5 lines appears to be the best representation of the data?
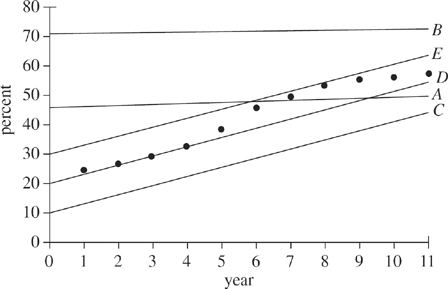
(A) A
(B) B
(C) C
(D) D
(E) E
During their daily training race, Carl has to stop to tie his shoes. Melissa, whose shoes are velcro, continues to run and gets 20 feet ahead of Carl. Melissa is running at a constant rate of 8 feet per second, and Carl starts running at a constant rate of 9.2 feet per second to catch up to Melissa. Which of the following equations, when solved for s, gives the number of seconds Carl will take to catch up to Melissa?
(F) 8s + 20 = 9.2s
(G) 8s - 20 = 9.2s
(H)  (J) 8s = 20
(K) 9.2s = 20
(J) 8s = 20
(K) 9.2s = 20
Correct Answer: F
An artist wants to cover the entire outside of a rectangular box with mosaic tiles. The dimensions of the box shown below are given in centimeters. If each tile is exactly one square centimeter, and the artist lays the tiles with no space between them, how many tiles will he need?

(F) 75 (G) 96 (H) 108 (J) 126 (K) 150
Correct Answer: K
What is the slope of the line determined by the equation 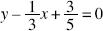 ?
?
(A)3
(B) 1
(C)  (D)
(D)  (E) -3
Correct Answer: C
More ACT Math Exam Questions
- 1
The perimeter of a square is 36 inches. What is the area of the square, in square inches?
- 2
The expression 9(y + 3) - 2(4y - 4) is equivalent to:
- 3
The table below details a recent census report about the commuting habits of U.S. workers age 16 or over for the years 2004, 2005, and 2006.

Expressed in millions of people, what was the average growth per year for female U.S. workers age 16 or over from 2004 to 2006, rounded to the nearest 0.1 million?
- 4
What is the value of 4 + 3x – y when x = 3 and y = -1?
- 5Melissa attaches her dog's leash to a metal anchor in the grass so that
the dog can roam only within a radius of 12 feet in any direction from
the anchor. A map of the area accessible to the dog is shown below in
the standard (x,y) coordinate plane, with the anchor at the origin and 1 coordinate unit representing 1 foot.
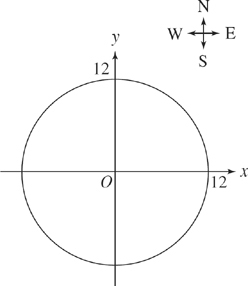 Which of the following is an equation of the circle shown on the map?